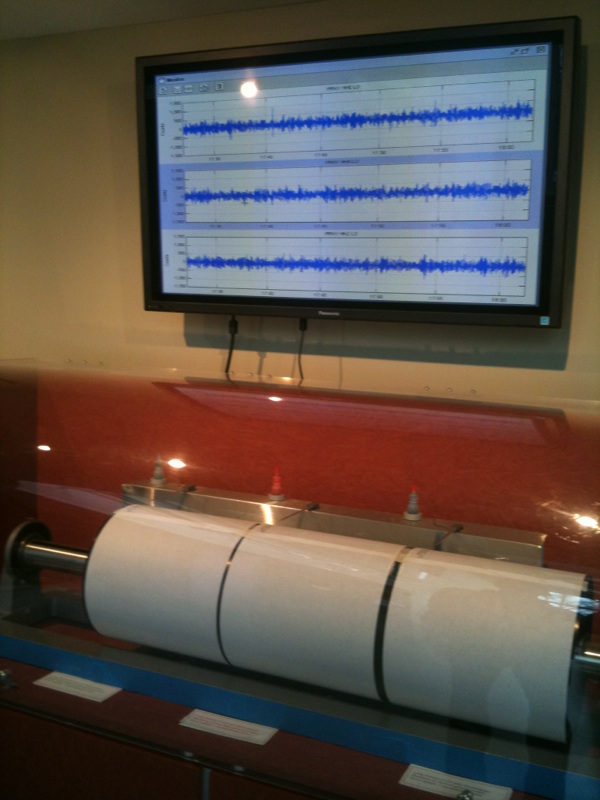
Last weekend we took a trip to Ithaca’s Museum of the Earth. Just past the exhibit about corn (oddly fascinating), was a seismograph machine. This complex device is used to recognize and measure global seismic activity, documenting and recording movement within the earth’s tectonic plates using an essentially simple graphic interface.
Although today data is captured in digital form, seismographs have also traditionally generated ink drawings that can be analyzed after a seismic event to determine the direction, duration and intensity of tectonic activity. To create this visual record, a piece of paper is wrapped around a drum. A very small and delicate pen rests very lightly on the surface of the paper. The cylinder rotates at a very slow rate of speed (see video below). When a tremor occurs, the pen tip records the duration and severity of the movement by leaving a jagged trail on the paper.
As it trails around the drum, the pen also slowly moves down the length of the cylinder, preventing the tip from writing over previous data. By the time the barrel has made one complete rotation (1 hour for the machine in this video), the pen tip has moved down the barrel by about an inch from its original position. The result is a long line of ink that spirals around the cylinder and down the page, recording any seismic activity that is registered by the equipment.
When I was a little kid, I used a similar technique to record the movement of the family car as we drove around town running errands or on longer road trips. I would let a pen or pencil rest just on the surface of the page, exerting as little pressure as possible, while maintaining contact between the tip and the paper. As we drove over bumps and around corners, the tip moved across the surface of the page, creating a cryptic record of our journey.
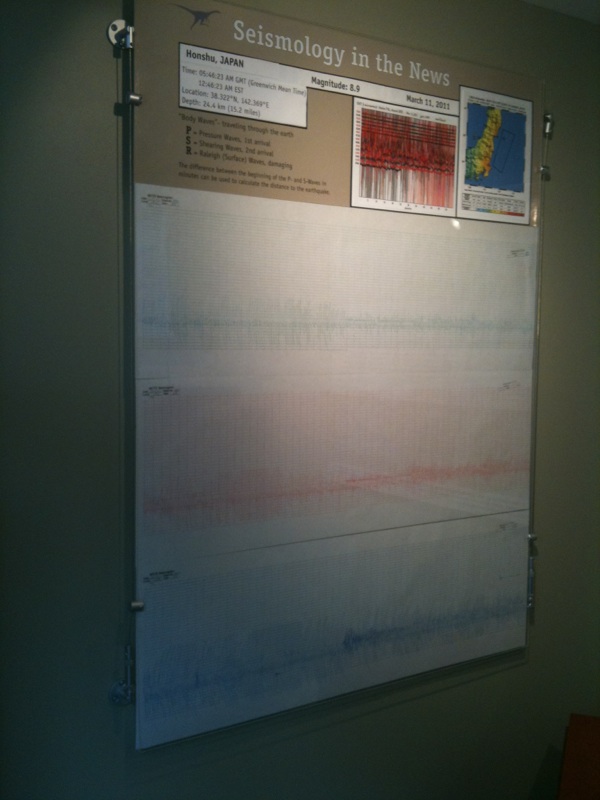
Two members of the museum staff were performing some routine maintenance on the equipment when we arrived, including changing the paper wrapped around the barrels and making sure that the ink reservoirs were filled. Displayed on the wall beside the machine were three graphs showing different dimensions of the movement of the earth during the tragic 9.0 earthquake that had occurred just off the coast of Japan.

Seismograms from March 11, 2011. The massive change in amplitude reflects the major earthquake that was centered off the north eastern coast of Japan.
The earthquake and resulting tsunamis had occurred just a day before our visit so the impact of the catastrophe was still unfolding as we stood listening to one of the museum staff explaining the images that we were examining. As we learned more about how to read the visual records, how to connect specific points on the continuous line with events from the news over the last day or so, the reality of what we were looking at sunk in.
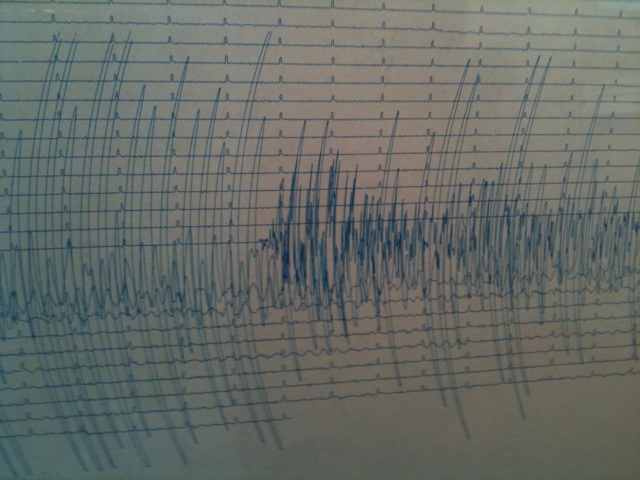
The museum display discussed the jagged line of the seismogram as a seemingly simple and straightforward record of change over time. However, as I registered exactly what I was looking at, my interpretation of that single continuous line became inextricably entwined with the memory of violent and terrifying images circulating on line since the quake. The coupling of radically different graphic representations of the same event created an image of undeniably brutal change. During the period of time when the earth’s crust was most highly agitated, the lines are dark, abrupt, thrusting up and down, aggressively pushing the limits of the recording device.
Museum staff explained that during this period of intense seismic activity, the island of Honshu had actually shifted eight feet to the east. At that moment standing there in the Museum of the Earth, following that single continuous line as it jumped, jutted and lunged across the page, I thought I was looking at what happens on earth when a change of that magnitude happens.
Over the next several days, the crisis in Japan continued to deepen. Nuclear power plants failed, the number of casualties soared, and a shortage of water, food and shelter reached critical points. Even more photos and videos poured on to the internet. I thought a lot about the violent change reflected in that single continuous line. And my perception of what it means to see change of such devastating magnitude changed.


